


Business of Welding: Ranking Your Welders
We live in a fast-food world: we expect everything to be fast; not just our food service, but also our Internet connections, cell phone service, mail delivery, and the list goes on. And let's not forget about the different types of production and fabrication lines we work at.
Time is money to those in the fabrication world. Time boundaries are set for all aspects of a fabrication project, including planning, designing, ordering material, manufacturing, and delivering the final product.
However, sometimes what we perceive as being fast and making us money can actually be costing us money in the long term. Too often in the welding world, what is looked at is how fast an automated machine or a person can deposit at certain amount of weld metal.
But in many cases, not all the costs of a weldment are considered when a company is determining profit margins.
The following is a short list of critical rework items of a fabrication that failed inspection. Each adds to the overhead on a welding project. If these items aren’t added to the final cost equation, it can be a business killer:
• Cost of grinding out defects (wages, raw material loss, consumable losses, supervision costs)
• Cost of lost production during rework time (false assumption that overtime replaces rework time as overtime could have been used to do new work)
• Cost of raw material (material cost, delivery cost, warehousing cost)
• Cost of rewelding (wages, supervision costs, rod, wire, shielding gases, cleaning supplies, safety equipment)
• Cost of weld inspection
• Cost of welding consumables (rod, wire, shielding gases, cleaning supplies, safety equipment)
• Daily wage of supervisor
• Daily wage of welder
• Speed of welder (how many inches per day of weld bead is laid down)
Every one of these items adds to the overhead cost of a fabrication. And never forget that lost production due to rework can never be regained because during the rework time, new product could have been made. And this lost potential profit has to be accounted for as a loss in your accounting books. Doing this forces you to look at ways to reduce rework in the first place. This is what drives some businesses to succeed where others fail during both good and bad economies.
Following is an example of how to rank your welders and how best to use them on your job site.
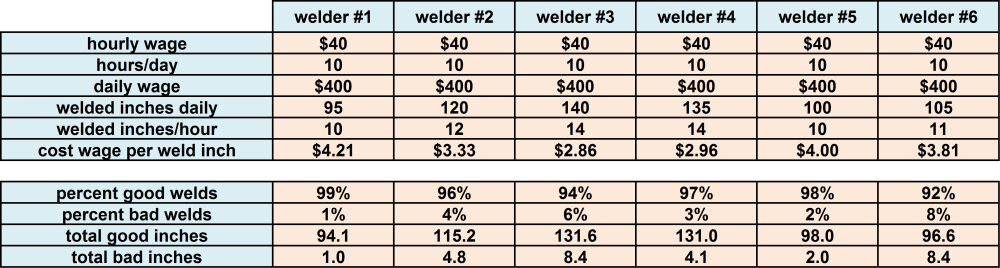
In this example, we have six welders on our team. The first section of a spreadsheet shows how many inches of weld they lay per day and their defect rate (Figure 1).
Figure 1: Basic information about this team of welders is charted.
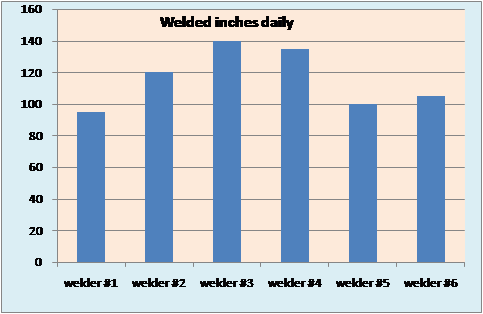
From this first part of a spreadsheet we can then make a graph to see how our team members rank in terms of the amount of weld that they can do daily (Figure 2).
Figure 2: This chart shows how the team members rank in terms of the amount of weld that they can do daily.
At first glance it seems that the team has two outstanding welders and two who do not seem to be pulling their weight. The data in this chart is what a lot of companies base their assumptions on when ranking their workers.
However, Figure 2 does not give a true picture of individual contributions in a fabrication setting.
In Figure 3 we start to see a better picture of what is really going on with our team. No welder can be expected to have perfect welds every time. In this example, the percentage of defective welds are somewhat distorted to highlight what we are talking about to make a point.
Figure 3: A second part of the spreadsheet takes into account weld inspection costs and the associated cost of rework.
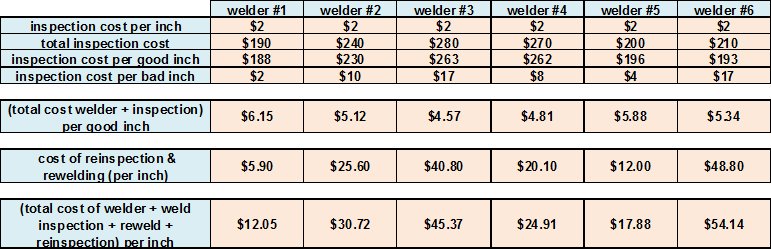
In Figure 3, you start to see how our first look at the welders may not actually be a true representation of their skills. So we now graph parts of this sheet to come up with Figure 4.
Figure 4: Another graph shows the cost of rework for each welder on the team.
You will notice the significant change in rankings from Figure 2. Welders that we thought were our top money-makers also may be causing us our biggest profit losses because they are also creating more defective welds. Welder 3 has gone from being an asset to perhaps being a liability. Welder 1 may have been seen as a slow welder but also seems to lay down the highest-quality welds requiring the least amount of rework.
At this point we are faced with a dilemma. We need more information on costs. So now we add more details. Figure 5 calculates what our welders are doing in terms of costs.
Figure 5: Our first examination of costs was incorrect. The slowest welder is actually the most economical one.
Notice from Figure 5 how the welders have switched positions somewhat from the last line in Figure 3. This can be hard to fathom. Figure 6 puts our findings in order.
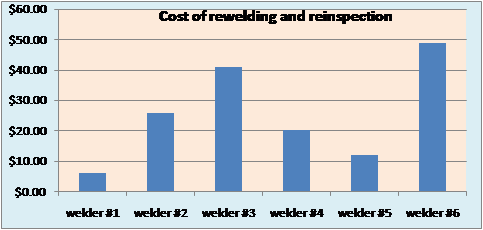
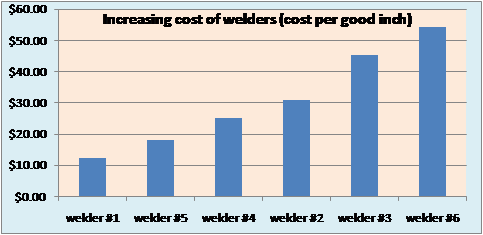
Figure 6: This chart reveals the actual order of the welders’ quality, from the lowest cost per inch of weld to the highest cost.
For a company owner or supervisor, this is the time for some real number-crunching and the deployment of the supervisors’ skills to maximize profits from this group of welders. Now is the time to think of the proverb that you cannot see the forest for the trees or that you cannot see the trees for the forest.
Take a good look at each welder, but also at the group and their work environment. Make a check list such as the one below and start going through it. Add more points as you think of them. This is a starting point, but maybe something will jump out at you as an obvious fix. But maybe not. Be patient and thorough in your investigations.
• Are nondestructive testing (NDT) inspectors testing the welds the same (X-ray vs. ultrasonic)?
• Are NDT inspectors trained the same way?
• Are NDT inspectors working in different conditions (inside vs. exposed to weather)?
• Are some welders working without supervision?
• Are welder skills the same? Having a certification ticket does not make all welders equal in skill.

• Are working conditions different (night shift vs. day shift or inside vs. outside)?
• Are there distractions (family/personal problems)?
• Is equipment access the same for all welders (welding rod drying ovens, clean equipment)?
• Do welder helpers have the same level of training?
• Are there workplace interaction issues (bullying)?
A welding team needs to be treated differently from the stereotypical car salespeople, for example, for whom the lowest-selling person gets let go every month and new salespeople brought in. Some companies and supervisors deal with tradespeople differently in a strong economy than in a bad economy. If there is a glut in the availability of tradespeople, they may be replaced more often. It all depends how much time and effort you want to spend on developing a strong welding team and working to resolve production and quality issues.
The bottom line is that welders are not all equal in terms of skills and abilities even if they have the same certification tickets. They may be doing the same work but in different work environments or their work may be inspected differently. These situations can magnify the skills and abilities chasm. This is where exercising due diligence on your part can go a long way in increasing profits by decreasing bad quality while still increasing production.
Orest Protch facilitates seminars in basic welding and machining metallurgy for apprentice & journeymen welders, machinists, fabricators & engineers across Canada. He can be reached at oprotch@hotmail.com.
subscribe now


Keep up to date with the latest news, events, and technology for all things metal from our pair of monthly magazines written specifically for Canadian manufacturers!
Start Your Free SubscriptionAbout the Author
About the Publication
- Stay connected from anywhere

Easily access valuable industry resources now with full access to the digital edition of Canadian Metalworking.
Easily access valuable industry resources now with full access to the digital edition of Canadian Fabricating & Welding.
- Trending Articles
1
CWB Group launches full-cycle assessment and training program

2
Achieving success with mechanized plasma cutting

3
3D laser tube cutting system available in 3, 4, or 5 kW
4
Brushless copper tubing cutter adjusts to ODs up to 2-1/8 in.

5
Welding system features four advanced MIG/MAG WeldModes